
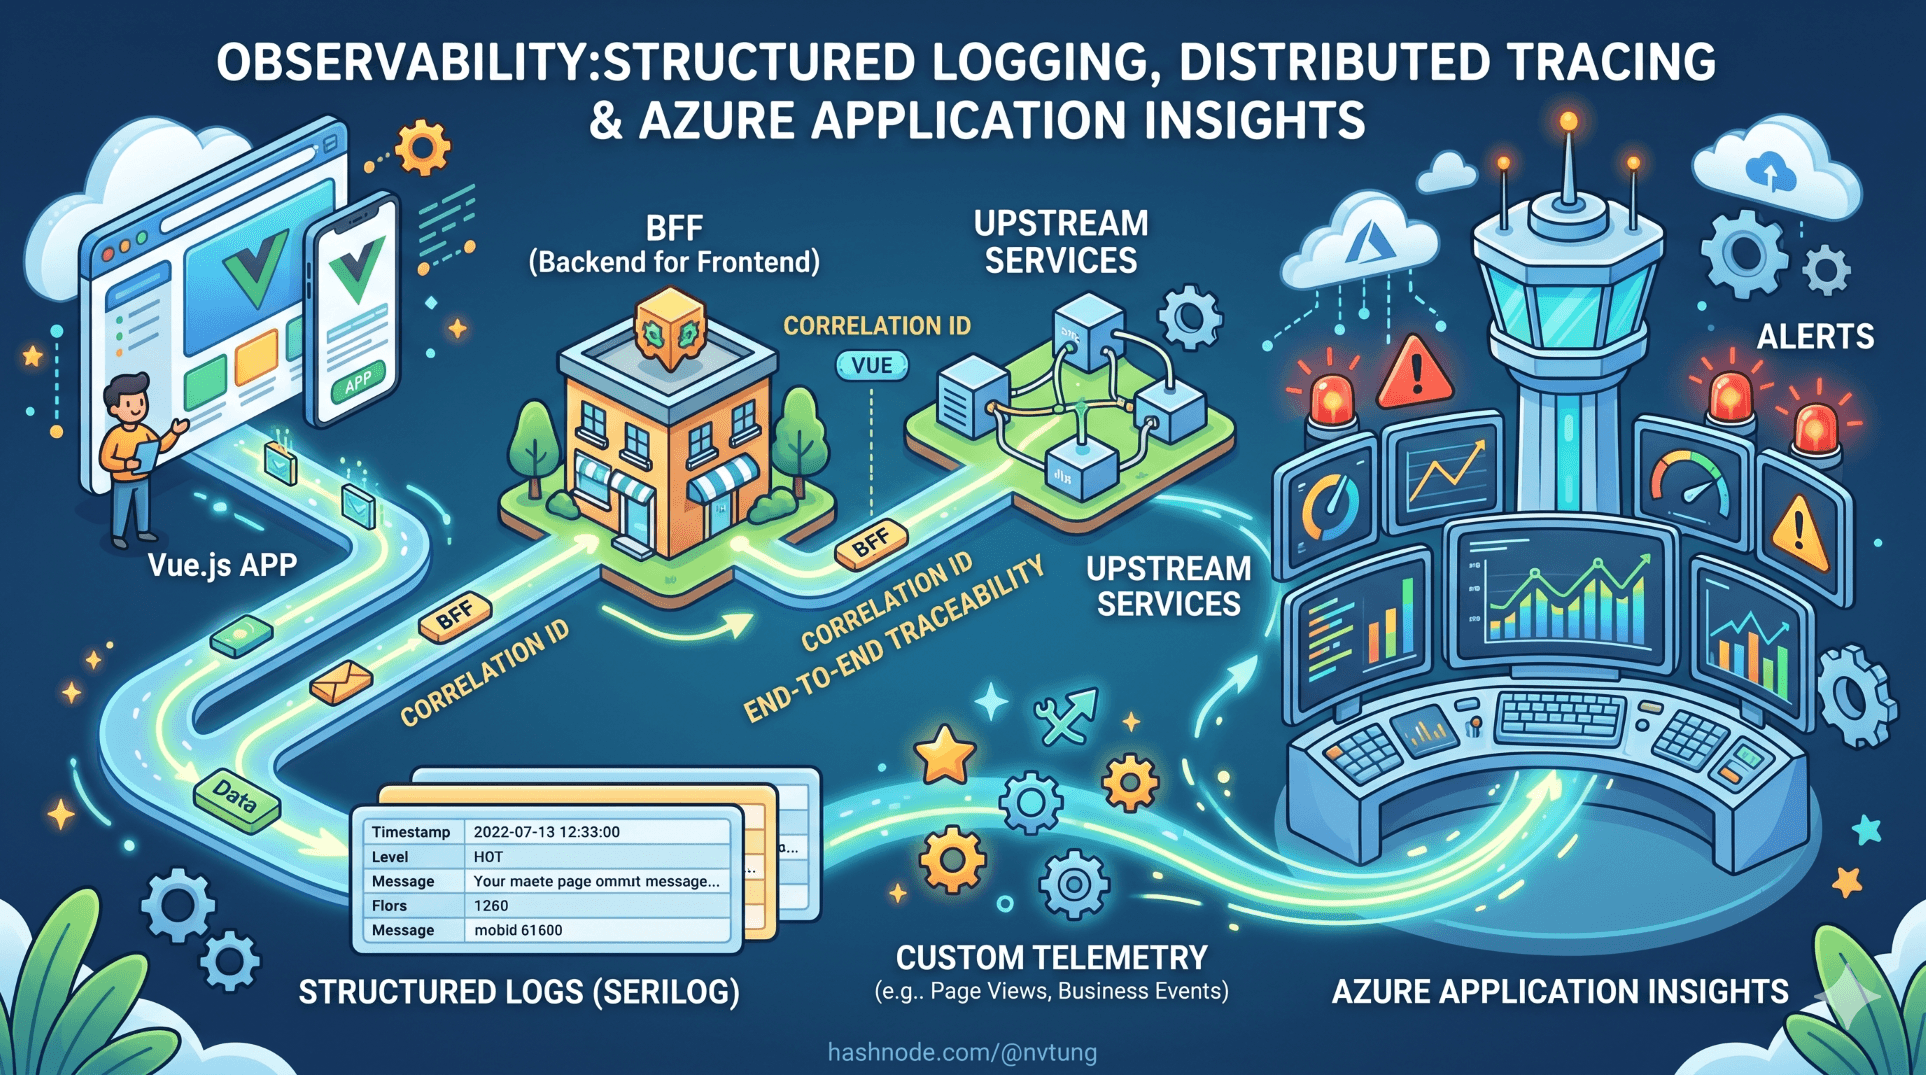
Observability for BFF: Structured Logging, Distributed Tracing & Azure Application Insights
End-to-end traceability across Vue → BFF → upstream services using Azure Application Insights. Correlation IDs, structured logs with Serilog, custom telemetry, and Application Insights dashboards and alerts.
A note on the code in this article. The observability setup shown here is derived from a production BFF built for a Norwegian enterprise education platform. Resource names, workspace identifiers, alert thresholds, and certain query specifics have been generalised to meet NDA obligations. The Serilog configuration, Application Insights integration, custom telemetry patterns, Kusto queries, and the specific operational decisions each choice addresses are drawn directly from what was deployed and monitored in production.
A BFF that aggregates multiple upstream services has an observability problem that a single-service system does not. When a request to GET /api/dashboard returns a 503, four upstream services are potential failure points. When it takes 2.8 seconds instead of the expected 300ms, any one of the three sequential aggregation phases might be the culprit. Without end-to-end traceability — a single thread of correlation that follows a request from the Vue application's fetch call through every BFF aggregator method and every upstream HTTP call — diagnosing production incidents means guessing.
This article builds that traceability: structured logging with Serilog, distributed tracing with Activity and correlation IDs, and the Application Insights configuration that ties them together into a queryable, alertable observability layer. It then covers the dashboard and alert setup that makes the difference between discovering an incident from a user report and discovering it from a monitor.
What observability means for this architecture
The request path for a dashboard load spans five distinct components:
Vue app (browser)
  └── fetch /api/dashboard
        └── BFF (.NET Core on ACI)
              ├── UserServiceClient     → User Service
              ├── NotificationClient    → Notification Service
              ├── CourseServiceClient   → Course Service
              └── SessionServiceClient  → Session Service
Full observability means being able to answer these questions from a single tool:
Which upstream service caused this request to fail or slow down?
What was the exact sequence of events for request
X-Correlation-Id: abc-123?Is the BFF's p95 latency within the defined budget for this week?
How many requests returned partial failures in the last 24 hours?
Did the 2am deployment degrade response times compared to before?

Application Insights can answer all of these — but only if the telemetry is structured correctly from the start. Unstructured logs and missing correlation IDs produce a tool that has data but cannot connect it.
Serilog: structured logging foundation
Install the packages established in Article 4's Program.cs, plus the destructuring policy for request logging:
dotnet add package Serilog.AspNetCore
dotnet add package Serilog.Sinks.ApplicationInsights
dotnet add package Serilog.Enrichers.Environment
dotnet add package Serilog.Enrichers.Process
dotnet add package Serilog.Enrichers.Thread
Full Serilog configuration
The Serilog configuration in Program.cs merges static enrichers, dynamic log context enrichers, and the Application Insights sink:
// Program.cs
builder.Host.UseSerilog((ctx, services, cfg) => cfg
    .ReadFrom.Configuration(ctx.Configuration)
    .ReadFrom.Services(services)
    .Enrich.FromLogContext()
    .Enrich.WithMachineName()
    .Enrich.WithEnvironmentName()
    .Enrich.WithProperty("Service",     "bff")
    .Enrich.WithProperty("Version",     ctx.Configuration["AppVersion"] ?? "unknown")
    .Enrich.WithProperty("Environment", ctx.HostingEnvironment.EnvironmentName)
    .WriteTo.Console(new RenderedCompactJsonFormatter())
    .WriteTo.ApplicationInsights(
        services.GetRequiredService<TelemetryConfiguration>(),
        TelemetryConverter.Traces,
        restrictedToMinimumLevel: LogEventLevel.Information));
The AppVersion property — injected as an environment variable in the ACI deployment — is the deployed image tag (the Git commit SHA from Article 7). Every log entry carries it. When a regression appears in Application Insights, filtering by Version immediately isolates whether the regression started with a specific deployment.
appsettings.json: log level configuration
{
  "Serilog": {
    "MinimumLevel": {
      "Default": "Information",
      "Override": {
        "Microsoft": "Warning",
        "Microsoft.Hosting.Lifetime": "Information",
        "System": "Warning",
        "System.Net.Http": "Warning"
      }
    }
  }
}
The System.Net.Http override is important. Without it, every outgoing HTTP request from the typed clients emits verbose debug logs about connection pools, headers, and DNS resolution — the majority of which are noise in production. Setting it to Warning keeps the log volume manageable and the signal-to-noise ratio high.
Structured log messages: writing for queryability
The difference between a log entry that helps and one that does not is almost entirely in whether its properties can be queried independently. Serilog's message template syntax — curly braces with named properties — is the mechanism.
// ✗ Unstructured — cannot be queried by orgId or courseCount
_logger.LogInformation($"Fetched {courses.Count} courses for org {orgId}");

// ✓ Structured — orgId and courseCount are queryable properties
_logger.LogInformation(
    "Fetched {CourseCount} courses for organisation {OrgId}",
    courses.Count, orgId);
In Application Insights, the structured version produces a customDimensions object with CourseCount and OrgId as named fields. A Kusto query can then aggregate course fetch counts by organisation, find organisations with unusually low course counts, or identify correlation between slow responses and specific organisations.
Aggregator-level logging
The aggregator logs the complete outcome of each aggregation — duration, upstream call results, partial failures — as a single structured entry:
// Aggregators/DashboardAggregator.cs
public async Task<DashboardResponse> AggregateAsync(
    string userId, CancellationToken ct = default)
{
    var sw = Stopwatch.StartNew();
    var partialFailures = new List<string>();

    using var _ = _logger.BeginScope(new Dictionary<string, object>
    {
        ["UserId"] = userId,
        ["AggregationType"] = "Dashboard"
    });

    _logger.LogInformation("Dashboard aggregation started for user {UserId}", userId);

    // ... aggregation logic from Article 4 ...

    sw.Stop();
    _logger.LogInformation(
        "Dashboard aggregation completed. " +
        "Duration: {DurationMs}ms, " +
        "CourseCount: {CourseCount}, " +
        "SessionCount: {SessionCount}, " +
        "NotificationCount: {NotificationCount}, " +
        "PartialFailures: {PartialFailureCount}, " +
        "FailedServices: {FailedServices}",
        sw.ElapsedMilliseconds,
        response.Courses.Count,
        response.UpcomingSessions.Count,
        response.Notifications.Count,
        partialFailures.Count,
        string.Join(",", partialFailures));

    return response;
}
Every aggregation produces exactly one completion log entry. In Application Insights, a query over DurationMs for these entries produces an accurate latency distribution for the dashboard endpoint across every upstream combination. No APM agent or custom metric is required — the structured log is the metric.
Correlation IDs: threading the trace
The CorrelationIdMiddleware from Article 4 ensures every request has a correlation ID. The missing piece in that implementation was propagating the ID through to Application Insights so log entries and dependency calls are all linked under the same operation.
Wiring the correlation ID to Application Insights operation ID
Application Insights uses Activity from System.Diagnostics as its distributed tracing primitive. The Activity.Current.Id is the operation ID that links all telemetry for a single request. The correlation ID middleware should use this ID rather than generating its own:
// Middleware/CorrelationIdMiddleware.cs — updated
public sealed class CorrelationIdMiddleware(RequestDelegate next)
{
    private const string CorrelationIdHeader = "X-Correlation-Id";

    public async Task InvokeAsync(HttpContext ctx)
    {
        // Prefer the inbound header (set by Front Door or API client)
        // Fall back to the Activity ID created by ASP.NET Core's tracing
        var correlationId =
            ctx.Request.Headers[CorrelationIdHeader].FirstOrDefault()
            ?? Activity.Current?.Id
            ?? ctx.TraceIdentifier;

        // Set it on the current Activity so Application Insights picks it up
        Activity.Current?.SetTag("correlation.id", correlationId);

        // Add to the Serilog log context for every log entry in this request
        using (LogContext.PushProperty("CorrelationId", correlationId))
        {
            ctx.Response.Headers[CorrelationIdHeader] = correlationId;
            await next(ctx);
        }
    }
}
With this wiring, searching Application Insights for a specific correlation ID surfaces:
The incoming BFF request (as a
requesttelemetry item)Every
LogInformation/LogWarningentry during that request (astraceitems)Every outgoing HTTP call to an upstream service (as
dependencyitems)
All linked under the same operation_Id. This is the end-to-end trace.
Application Insights: SDK configuration
The Application Insights SDK auto-collects request telemetry, dependency calls, and exceptions. Configure it in Program.cs:
// Program.cs
builder.Services.AddApplicationInsightsTelemetry(options =>
{
    options.ConnectionString =
        builder.Configuration["ApplicationInsights:ConnectionString"];
    options.EnableAdaptiveSampling = false; // Disable sampling in production BFF
    options.EnableDependencyTrackingTelemetryModule = true;
    options.EnableRequestTrackingTelemetryModule    = true;
});

// Add a telemetry initialiser to enrich every telemetry item
// with the same properties Serilog adds to log entries
builder.Services.AddSingleton<ITelemetryInitializer, BffTelemetryInitializer>();
// Telemetry/BffTelemetryInitializer.cs
public sealed class BffTelemetryInitializer(IConfiguration config) : ITelemetryInitializer
{
    private readonly string _version     = config["AppVersion"] ?? "unknown";
    private readonly string _environment = config["ASPNETCORE_ENVIRONMENT"] ?? "Production";

    public void Initialize(ITelemetry telemetry)
    {
        telemetry.Context.Cloud.RoleName    = "bff";
        telemetry.Context.Component.Version = _version;

        if (telemetry is ISupportProperties props)
        {
            props.Properties["Service"]     = "bff";
            props.Properties["Version"]     = _version;
            props.Properties["Environment"] = _environment;
        }
    }
}
EnableAdaptiveSampling = false is a deliberate choice for a BFF. Adaptive sampling reduces telemetry volume by dropping a percentage of requests — which is appropriate for high-volume services where cost is a concern. A BFF serving an education platform with a bounded user base generates manageable telemetry volume. Disabling sampling means every request, every dependency call, and every exception is recorded — which is the correct trade-off when the primary goal is incident diagnosis rather than cost management.
RoleName = "bff" ensures that in Application Insights' Application Map, the BFF node is labelled correctly and distinct from the upstream services. Without this, every service in the map appears as a generic unnamed cloud role.
Custom telemetry: tracking aggregation outcomes
The SDK auto-tracks requests and dependencies. What it cannot track automatically is the business-level outcome of an aggregation — how many partial failures occurred, how long each upstream phase took, which upstream service was the slowest on a given request. Custom metrics fill this gap.
// Telemetry/AggregationTelemetry.cs
public sealed class AggregationTelemetryService(TelemetryClient telemetryClient)
{
    public void TrackDashboardAggregation(
        string userId,
        long durationMs,
        int courseCount,
        int sessionCount,
        IReadOnlyList<string> partialFailures)
    {
        // Custom event — queryable by name in Application Insights
        var evt = new EventTelemetry("DashboardAggregationCompleted");
        evt.Properties["UserId"]             = userId;
        evt.Properties["PartialFailures"]    = string.Join(",", partialFailures);
        evt.Properties["HasPartialFailure"]  = (partialFailures.Count > 0).ToString();
        evt.Metrics["DurationMs"]            = durationMs;
        evt.Metrics["CourseCount"]           = courseCount;
        evt.Metrics["SessionCount"]          = sessionCount;
        evt.Metrics["PartialFailureCount"]   = partialFailures.Count;
        telemetryClient.TrackEvent(evt);

        // Custom metric — appears in Metrics Explorer for trending
        telemetryClient.GetMetric("DashboardAggregation.DurationMs")
            .TrackValue(durationMs);

        if (partialFailures.Count > 0)
        {
            telemetryClient.GetMetric("DashboardAggregation.PartialFailures")
                .TrackValue(partialFailures.Count);

            foreach (var service in partialFailures)
            {
                var failureEvt = new EventTelemetry("UpstreamServiceFailure");
                failureEvt.Properties["Service"]    = service;
                failureEvt.Properties["Endpoint"]   = "Dashboard";
                failureEvt.Properties["UserId"]     = userId;
                telemetryClient.TrackEvent(failureEvt);
            }
        }
    }

    public IOperationHolder<DependencyTelemetry> TrackUpstreamPhase(
        string phaseName, string upstreamService)
    {
        var dependency = new DependencyTelemetry
        {
            Name   = $"{upstreamService} - {phaseName}",
            Type   = "BFF Aggregation Phase",
            Target = upstreamService
        };
        return telemetryClient.StartOperation(dependency);
    }
}
Inject and use in the aggregator:
// Aggregators/DashboardAggregator.cs — updated with custom telemetry
public async Task<DashboardResponse> AggregateAsync(
    string userId, CancellationToken ct = default)
{
    var sw = Stopwatch.StartNew();
    var partialFailures = new List<string>();

    // Phase 1: independent calls with per-phase timing
    using var phase1 = _telemetry.TrackUpstreamPhase("Phase1-Parallel", "User+Notification");
    var profileTask      = _userClient.GetProfileAsync(userId, ct);
    var notificationTask = _notificationClient.GetUnreadCountAsync(userId, ct);
    await Task.WhenAll(profileTask, notificationTask);
    phase1.Telemetry.Success = true;

    var profile = profileTask.Result;
    if (profile is null)
    {
        _telemetryService.TrackEvent("DashboardAggregationFailed",
            new Dictionary<string, string>
            {
                ["Reason"]  = "ProfileServiceUnavailable",
                ["UserId"]  = userId
            });
        throw new BffAggregationException("User profile service unavailable.");
    }

    // Phase 2
    using var phase2 = _telemetry.TrackUpstreamPhase("Phase2-Courses", "CourseService");
    var courses = await _courseClient.GetCoursesByOrgAsync(profile.OrgId, ct);
    phase2.Telemetry.Success = courses is not null;
    if (courses is null) partialFailures.Add("courses");

    // Phase 3
    IReadOnlyList<SessionDto>? sessions = null;
    if (courses is not null && courses.Count > 0)
    {
        using var phase3 = _telemetry.TrackUpstreamPhase("Phase3-Sessions", "SessionService");
        sessions = await _sessionClient.GetUpcomingAsync(
            courses.Select(c => c.Id).ToArray(), 3, ct);
        phase3.Telemetry.Success = sessions is not null;
        if (sessions is null) partialFailures.Add("sessions");
    }

    var response = BuildResponse(profile, courses, sessions,
        notificationTask.Result, partialFailures);

    sw.Stop();
    _telemetryService.TrackDashboardAggregation(
        userId, sw.ElapsedMilliseconds,
        response.Courses.Count, response.UpcomingSessions.Count,
        partialFailures);

    return response;
}
Each aggregation phase is now a named dependency item in Application Insights. The Application Map shows the BFF node, its dependency on Phase1-Parallel, Phase2-Courses, and Phase3-Sessions, and the duration of each phase for each request. When a dashboard load is slow, the map immediately identifies which phase — and therefore which upstream service — is responsible.
Request logging: the Serilog request pipeline
UseSerilogRequestLogging() replaces ASP.NET Core's default request logging with Serilog's structured equivalent. Configure it to include the correlation ID and response size:
// Program.cs
app.UseSerilogRequestLogging(opts =>
{
    opts.EnrichDiagnosticContext = (diagCtx, httpCtx) =>
    {
        diagCtx.Set("RequestHost",     httpCtx.Request.Host.Value);
        diagCtx.Set("RequestScheme",   httpCtx.Request.Scheme);
        diagCtx.Set("UserAgent",       httpCtx.Request.Headers.UserAgent.ToString());
        diagCtx.Set("CorrelationId",
            httpCtx.Response.Headers["X-Correlation-Id"].FirstOrDefault() ?? "none");

        if (httpCtx.User.Identity?.IsAuthenticated == true)
            diagCtx.Set("UserId",
                httpCtx.User.FindFirstValue(ClaimTypes.NameIdentifier));
    };

    // Suppress health probe logs — they are noise at 30s intervals
    opts.GetLevel = (httpCtx, elapsed, ex) =>
    {
        if (httpCtx.Request.Path.StartsWithSegments("/health"))
            return LogEventLevel.Verbose; // Verbose is below minimum level — effectively suppressed
        if (ex is not null || httpCtx.Response.StatusCode >= 500)
            return LogEventLevel.Error;
        if (httpCtx.Response.StatusCode >= 400)
            return LogEventLevel.Warning;
        return LogEventLevel.Information;
    };
});
The health probe suppression is not cosmetic. At 30-second intervals, health probes generate 2,880 log entries per day per instance — entries that contain no operational information and inflate the Application Insights ingestion cost. Suppressing them by setting their level to Verbose (below the Information minimum) keeps the log volume meaningful.
Tracking the Vue application: browser telemetry
Application Insights has a JavaScript SDK that tracks client-side page loads, AJAX requests, and exceptions. Installing it in the Vue application completes the end-to-end trace — a slow page load can now be correlated with the specific BFF request that served it.
npm install @microsoft/applicationinsights-web
// src/telemetry/appInsights.ts
import { ApplicationInsights } from '@microsoft/applicationinsights-web'

export const appInsights = new ApplicationInsights({
  config: {
    connectionString: import.meta.env.VITE_APPINSIGHTS_CONNECTION_STRING,
    enableAutoRouteTracking: true,    // Track Vue Router navigations as page views
    enableCorsCorrelation: true,      // Propagate correlation headers on fetch calls
    correlationHeaderExcludedDomains: ['*.dataporten.no'], // Don't add headers to Feide
    disableFetchTracking: false,      // Track all fetch calls (BFF API calls)
    enableRequestHeaderTracking: true,
    enableResponseHeaderTracking: true
  }
})

appInsights.loadAppInsights()
// src/main.ts
import { appInsights } from './telemetry/appInsights'
import { useSessionStore } from './stores/session'

appInsights.trackPageView()

// Set the authenticated user context once the session is known
// This links all telemetry from this browser session to the user
const app = createApp(App)
app.use(pinia)
app.use(router)

const session = useSessionStore()
session.initialise().then(() => {
  if (session.profile) {
    appInsights.setAuthenticatedUserContext(
      session.profile.principalName,
      session.profile.orgId,
      true // Store in cookie for cross-session correlation
    )
  }
})

app.mount('#app')
enableCorsCorrelation: true is the key setting. With this enabled, the Application Insights SDK automatically adds Request-Context and Request-Id headers to every fetch call the Vue application makes. The BFF receives these headers and links its server-side telemetry to the same operation ID as the browser-side telemetry. In Application Insights' end-to-end transaction view, a single operation shows the browser page load, the fetch /api/dashboard call, and every upstream dependency the BFF triggered — all as one unified trace.
Kusto queries: turning telemetry into answers
The Application Insights data model is queried with Kusto Query Language (KQL). The following queries are the ones that were actually pinned to the production dashboard and alerted on.
BFF request latency by endpoint
requests
| where timestamp > ago(24h)
| where cloud_RoleName == "bff"
| where name !contains "health"
| summarize
    p50  = percentile(duration, 50),
    p95  = percentile(duration, 95),
    p99  = percentile(duration, 99),
    count = count()
    by name
| order by p95 desc
This query identifies which BFF endpoints are slowest at the p95 level — the level that matters for real user experience, not average which hides tail latency.
Partial failure rate over time
customEvents
| where timestamp > ago(24h)
| where name == "UpstreamServiceFailure"
| summarize failureCount = count() by
    Service = tostring(customDimensions["Service"]),
    bin(timestamp, 1h)
| render timechart
This is the alert query. When CourseService partial failures spike from 0 to 40 in an hour, the chart shows the exact moment the upstream service degraded — before any user report arrives.
Aggregation duration distribution
customEvents
| where timestamp > ago(24h)
| where name == "DashboardAggregationCompleted"
| extend
    durationMs   = todouble(customMeasurements["DurationMs"]),
    hasFailure   = tobool(customDimensions["HasPartialFailure"])
| summarize
    p50  = percentile(durationMs, 50),
    p95  = percentile(durationMs, 95),
    count = count()
    by hasFailure
This reveals something the standard latency query does not: whether partial failures (degraded responses) are faster or slower than fully successful responses. In the production system, partial failures were consistently faster because the failed upstream service had timed out rather than returned slowly — the timeout was the signal, not the duration. This query made that visible.
Error rate by status code
requests
| where timestamp > ago(1h)
| where cloud_RoleName == "bff"
| summarize count() by resultCode
| render piechart
A simple query, but critical for incident triage. A spike in 503s identifies a BFF-level failure (upstream services down). A spike in 401s identifies an authentication issue. A spike in 500s identifies an unhandled exception in the BFF itself.
End-to-end trace for a specific correlation ID
let correlationId = "abc-123-def-456";
union requests, dependencies, traces, exceptions
| where timestamp > ago(24h)
| where operation_Id contains correlationId
    or customDimensions["CorrelationId"] == correlationId
| order by timestamp asc
| project timestamp, itemType, name, duration, success,
          message, customDimensions
This is the incident diagnosis query. A user reports an error at 14:32 and provides the correlation ID from the UI (the traceId in the ErrorDisplay component from Article 5). This query returns every telemetry item — request, dependency calls, log entries, exceptions — for that specific request, in chronological order.
Dashboard configuration
The production Application Insights workbook had four panels pinned for daily review and incident response:
Panel 1: Request volume and error rate (30-minute bins)
requests
| where cloud_RoleName == "bff"
| where name !contains "health"
| summarize
    total     = count(),
    errors    = countif(success == false),
    errorRate = round(100.0 * countif(success == false) / count(), 2)
    by bin(timestamp, 30m)
| render timechart with (series = errorRate)
Panel 2: Upstream service availability
dependencies
| where cloud_RoleName == "bff"
| where type == "Http"
| summarize
    total   = count(),
    failed  = countif(success == false),
    failPct = round(100.0 * countif(success == false) / count(), 2)
    by target, bin(timestamp, 1h)
| where failed > 0
| order by failPct desc
Panel 3: Aggregation latency heatmap
customEvents
| where name == "DashboardAggregationCompleted"
| extend durationMs = todouble(customMeasurements["DurationMs"])
| summarize count() by
    latencyBucket = case(
        durationMs < 200,   "< 200ms",
        durationMs < 500,   "200–500ms",
        durationMs < 1000,  "500ms–1s",
        durationMs < 2000,  "1–2s",
        ">= 2s"),
    bin(timestamp, 1h)
| render timechart
Panel 4: Top exceptions in the last hour
exceptions
| where cloud_RoleName == "bff"
| where timestamp > ago(1h)
| summarize count() by type, outerMessage
| order by count_ desc
| take 10
Alerts
Three alerts were active in the production system. Each was configured in Azure Monitor with an action group that sent an email and a Teams webhook notification.
Alert 1: Error rate threshold
// Fires when error rate exceeds 5% over a 5-minute window
requests
| where cloud_RoleName == "bff"
| where name !contains "health"
| where timestamp > ago(5m)
| summarize
    total  = count(),
    errors = countif(success == false)
| extend errorRate = 100.0 * errors / total
| where errorRate > 5
Threshold: 5% error rate. Evaluation frequency: every 5 minutes. Severity: 2 (High).
Alert 2: Upstream service degradation
// Fires when any upstream service fails more than 10 times in 10 minutes
customEvents
| where name == "UpstreamServiceFailure"
| where timestamp > ago(10m)
| summarize failureCount = count() by Service = tostring(customDimensions["Service"])
| where failureCount > 10
Threshold: 10 failures. Evaluation frequency: every 5 minutes. Severity: 1 (Critical).
This alert fires before the error rate alert in most upstream outage scenarios. When the course service goes down, the first few dozen requests produce partial failure responses (200 with partialFailures: ["courses"]) rather than 5xx errors. The error rate alert would not fire; this alert catches the upstream degradation regardless of whether the BFF successfully served a degraded response.
Alert 3: Aggregation latency budget
// Fires when p95 aggregation duration exceeds 1500ms over 15 minutes
customEvents
| where name == "DashboardAggregationCompleted"
| where timestamp > ago(15m)
| summarize p95 = percentile(todouble(customMeasurements["DurationMs"]), 95)
| where p95 > 1500
Threshold: 1500ms p95. Evaluation frequency: every 5 minutes. Severity: 2 (High).
The 1500ms threshold was derived from the production latency budget: 300ms for Phase 1, 300ms for Phase 2, 300ms for Phase 3, 600ms buffer for BFF processing and network. When p95 exceeds 1500ms, one of the upstream services is slow — the dependency telemetry identifies which one.
What the production system learned about observability
Health probe log suppression was added after the first week. The initial configuration logged every health probe at Information level. After one week of ACI deployment with 30-second probe intervals, the Application Insights log volume was 40% health probe entries. The GetLevel override was added in week two and immediately reduced ingestion cost and improved signal clarity.
The AppVersion property on every telemetry item paid off in the third deployment. A latency regression appeared in the p95 chart after the third deployment to production. Filtering customEvents by Version == "sha-abc123" versus Version == "sha-def456" isolated the regression to the new deployment within two minutes. Without the version property, the investigation would have started with checking the deployment log to determine when the regression began.
Partial failure alerts preceded user reports by an average of 12 minutes. In the three upstream service degradations that occurred during the production period, the UpstreamServiceFailure alert fired an average of 12 minutes before any user submitted a support ticket. In two of the three cases, the upstream team was already aware before the first user contacted support. The BFF's partial failure model — returning degraded responses rather than errors — meant users experienced degraded functionality rather than outages, reducing the severity of each incident.
setAuthenticatedUserContext was not added until month two. The browser-side Application Insights setup initially did not set the authenticated user context. This meant browser telemetry could not be correlated with a specific user's session when investigating a reported issue. Adding setAuthenticatedUserContext after month two connected the browser page view telemetry to the same user ID used in server-side logs — making the end-to-end trace genuinely end-to-end.

The complete observability picture
A production incident on this system — a user reports the dashboard is slow — resolves as follows:
The user reads the
traceIdfrom the error display or the support team extracts it from the correlation ID in the request log.The end-to-end trace query returns every item for that request in 3 seconds.
The dependency telemetry shows Phase 3 (Sessions) took 2,400ms — the session service was the culprit.
The upstream service failure alert fired 8 minutes before the user reported the issue.
The session service team's runbook is triggered.
Resolution.

This is what observability looks like when it is designed in rather than added later. Every decision in this series — structured logs, correlation IDs, custom aggregation events, the traceId in the Vue error component, the AppVersion on every telemetry item — was made with this incident resolution flow in mind.
Series conclusion
This is the ninth and final article in the core series. The BFF is designed, built, secured, deployed, tested, and observable. What was built:
A Vue 3 frontend with a typed API layer generated from the BFF's OpenAPI spec, composables with consistent error handling, and browser telemetry connected to the server-side trace.
A .NET Core 8 BFF with Minimal API endpoints, a typed client / aggregator / contract architecture, Feide OIDC integration using the Token Handler pattern, and a layered test suite from unit through contract.
An Azure IaaS deployment with Azure Container Instances, Azure Front Door, and a full CI/CD pipeline from commit to production with a manual approval gate.
An observability layer with Serilog structured logging, distributed tracing via Activity and correlation IDs, custom Application Insights telemetry, and production-validated KQL queries and alerts.
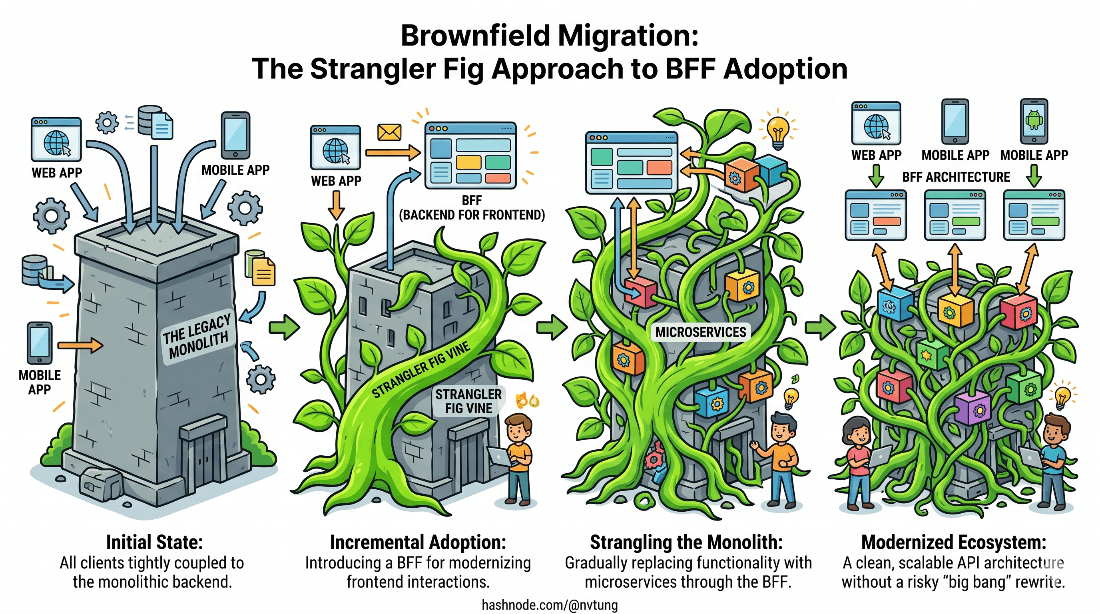
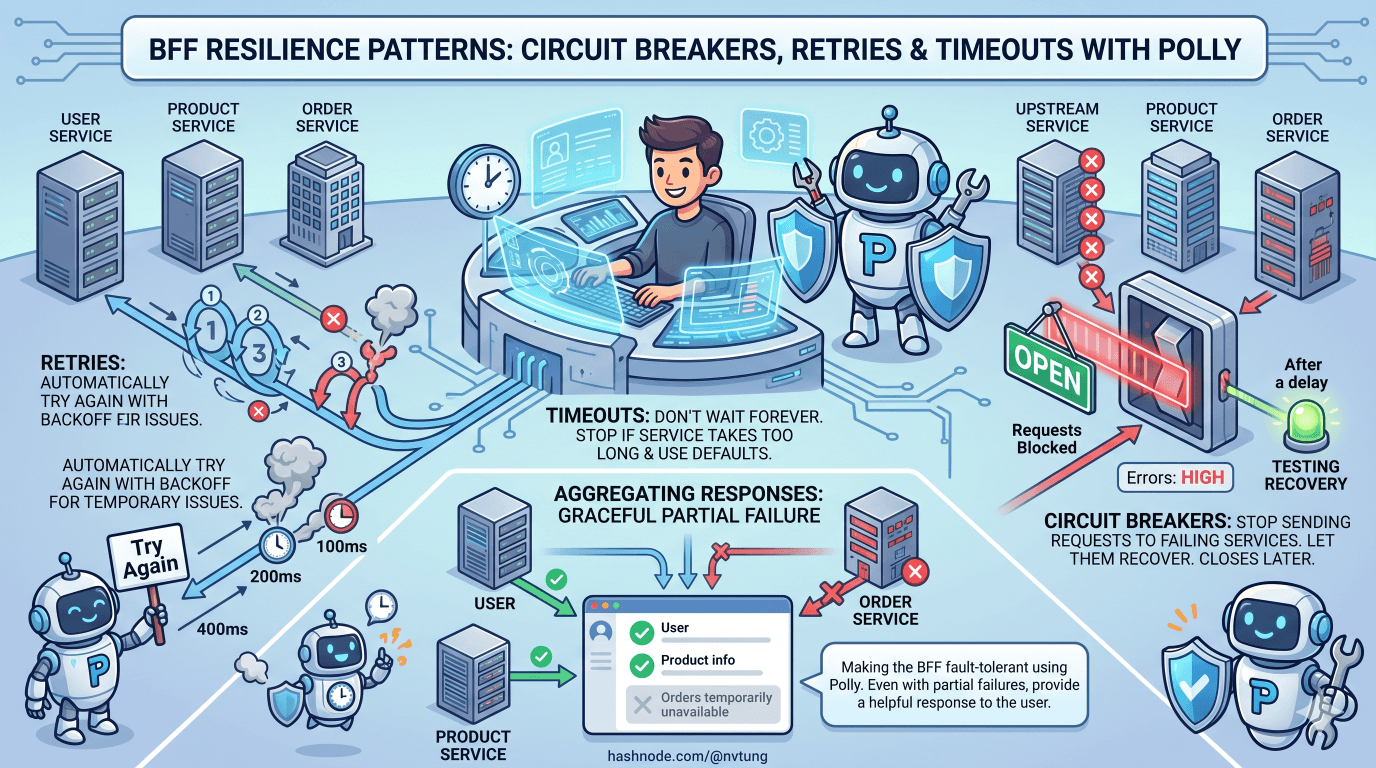
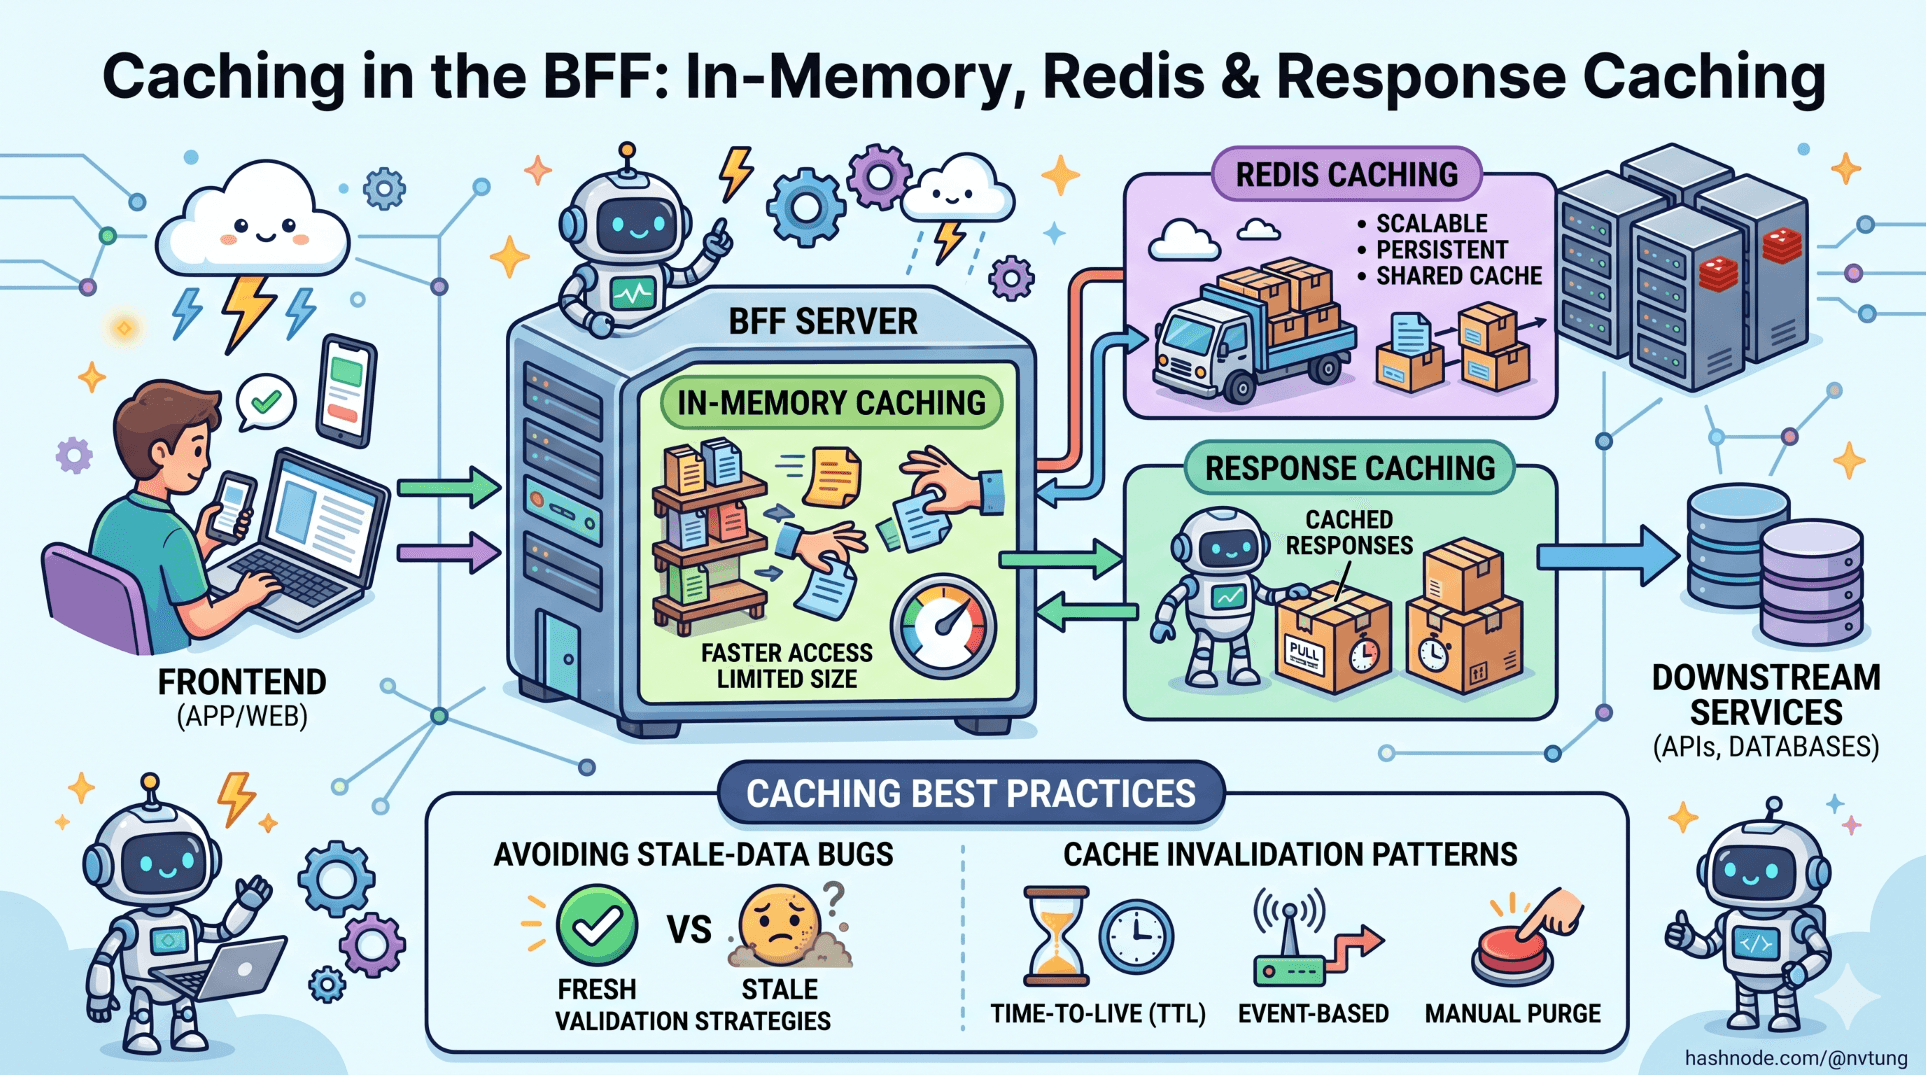
The three supplementary articles — caching strategies, brownfield migration with the Strangler Fig pattern, and resilience patterns with Polly — extend the architecture into the production scenarios most likely to arise once the core system is running. They are written to be read independently as those needs arise.