
Observability for Event-Driven Systems
Monitoring flow, lag, and failure across asynchronous pipelines
Series: Designing a Microservice-Friendly Datahub
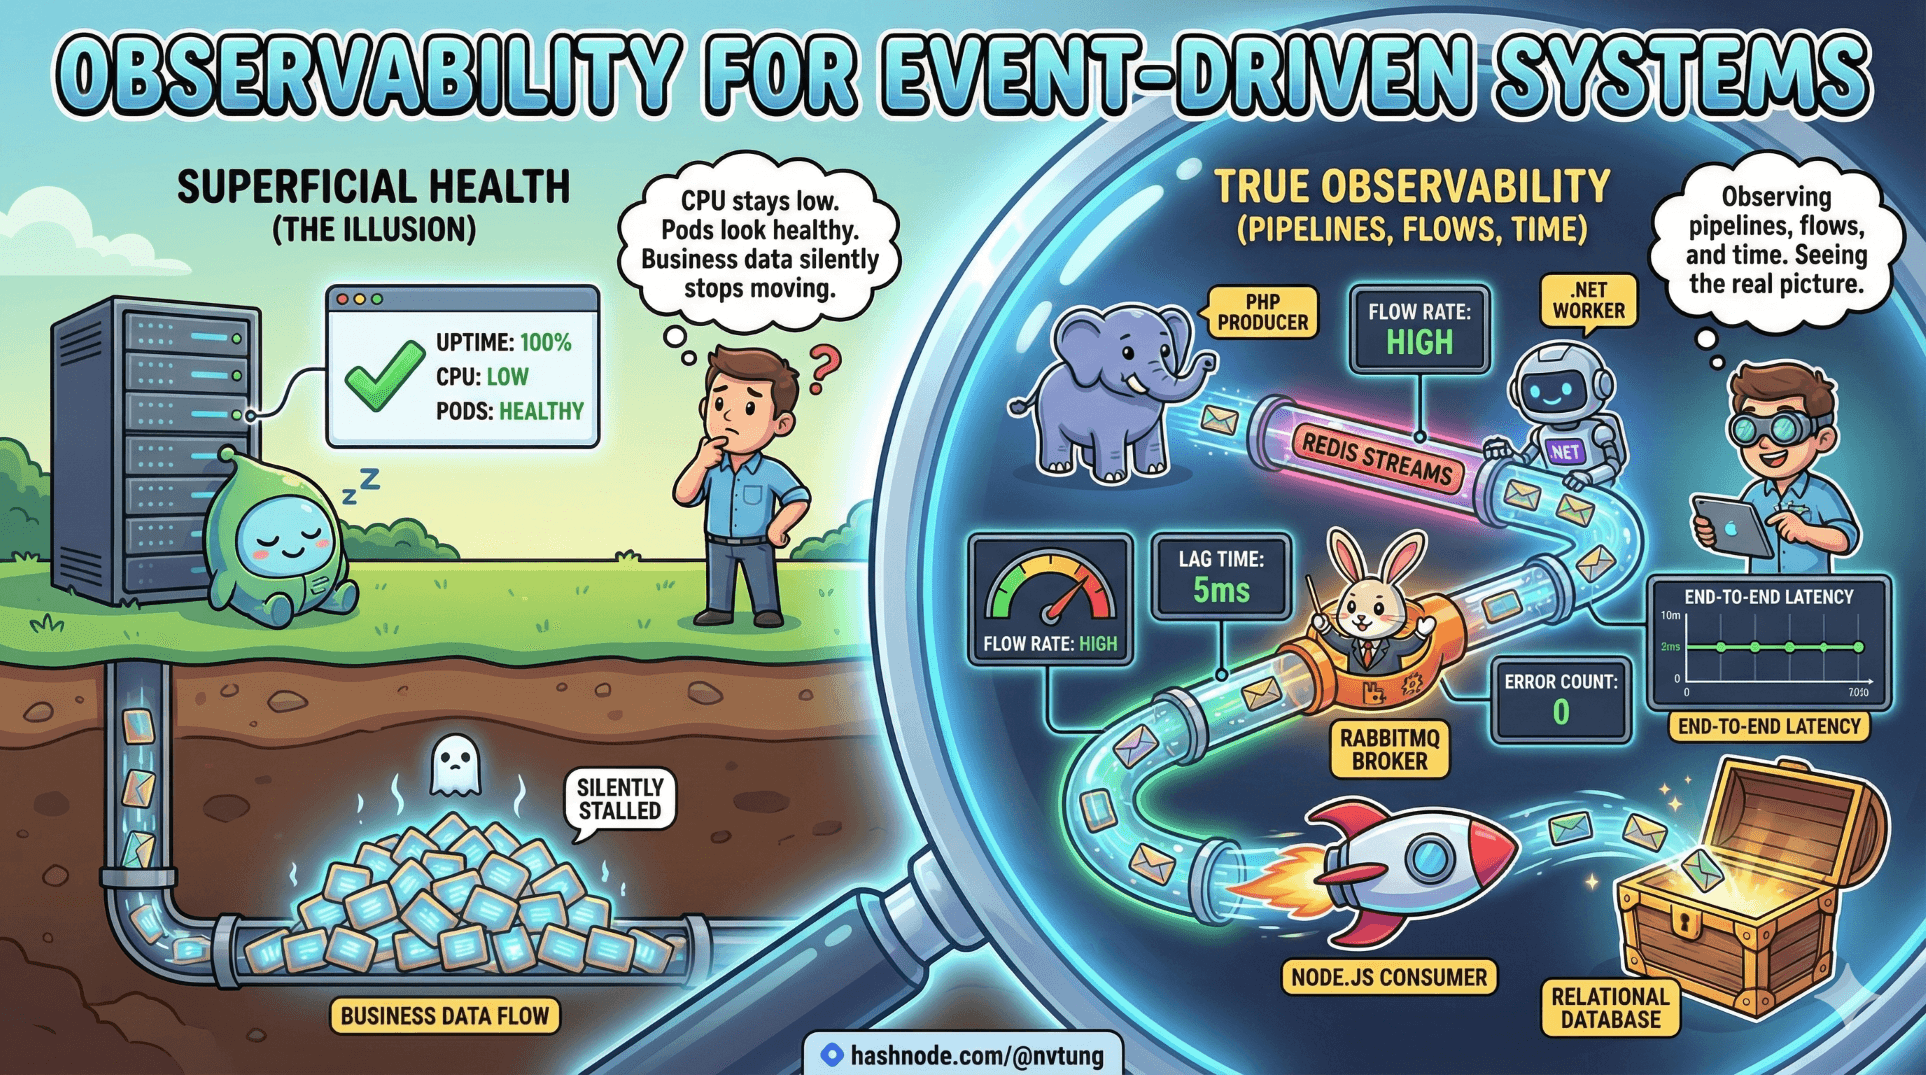
Event-driven systems don’t usually fail loudly. They drift, stall, or silently fall behind. CPU stays low. Pods look healthy. Uptime dashboards glow green—while business data quietly stops moving.
This is why observability in event-driven systems is fundamentally different from observability in request/response architectures. You are not observing services. You are observing pipelines, flows, and time.
This article explains how to build real observability for event-driven systems using the same stack you’ve seen throughout this series: PHP, Redis Streams, .NET, RabbitMQ, Node.js, and relational databases.
The Core Shift: From Nodes to Flow
Traditional observability asks:
Is the service up?
Is CPU high?
Are requests failing?
Event-driven observability asks:
Is data still flowing?
Where is it slowing down?
What is stuck, duplicated, or lost?
How long does an event take to propagate?

A system can be up and completely broken at the same time.
The Three Pillars (Reinterpreted)
The classic pillars—logs, metrics, traces—still apply, but their meaning changes.

1. Logs → Event Narratives
Logs should tell the story of an event.
2. Metrics → Flow Health
Metrics should describe movement and pressure, not just resource usage.
3. Traces → Causality Across Time
Traces should connect asynchronous steps that never share a call stack.
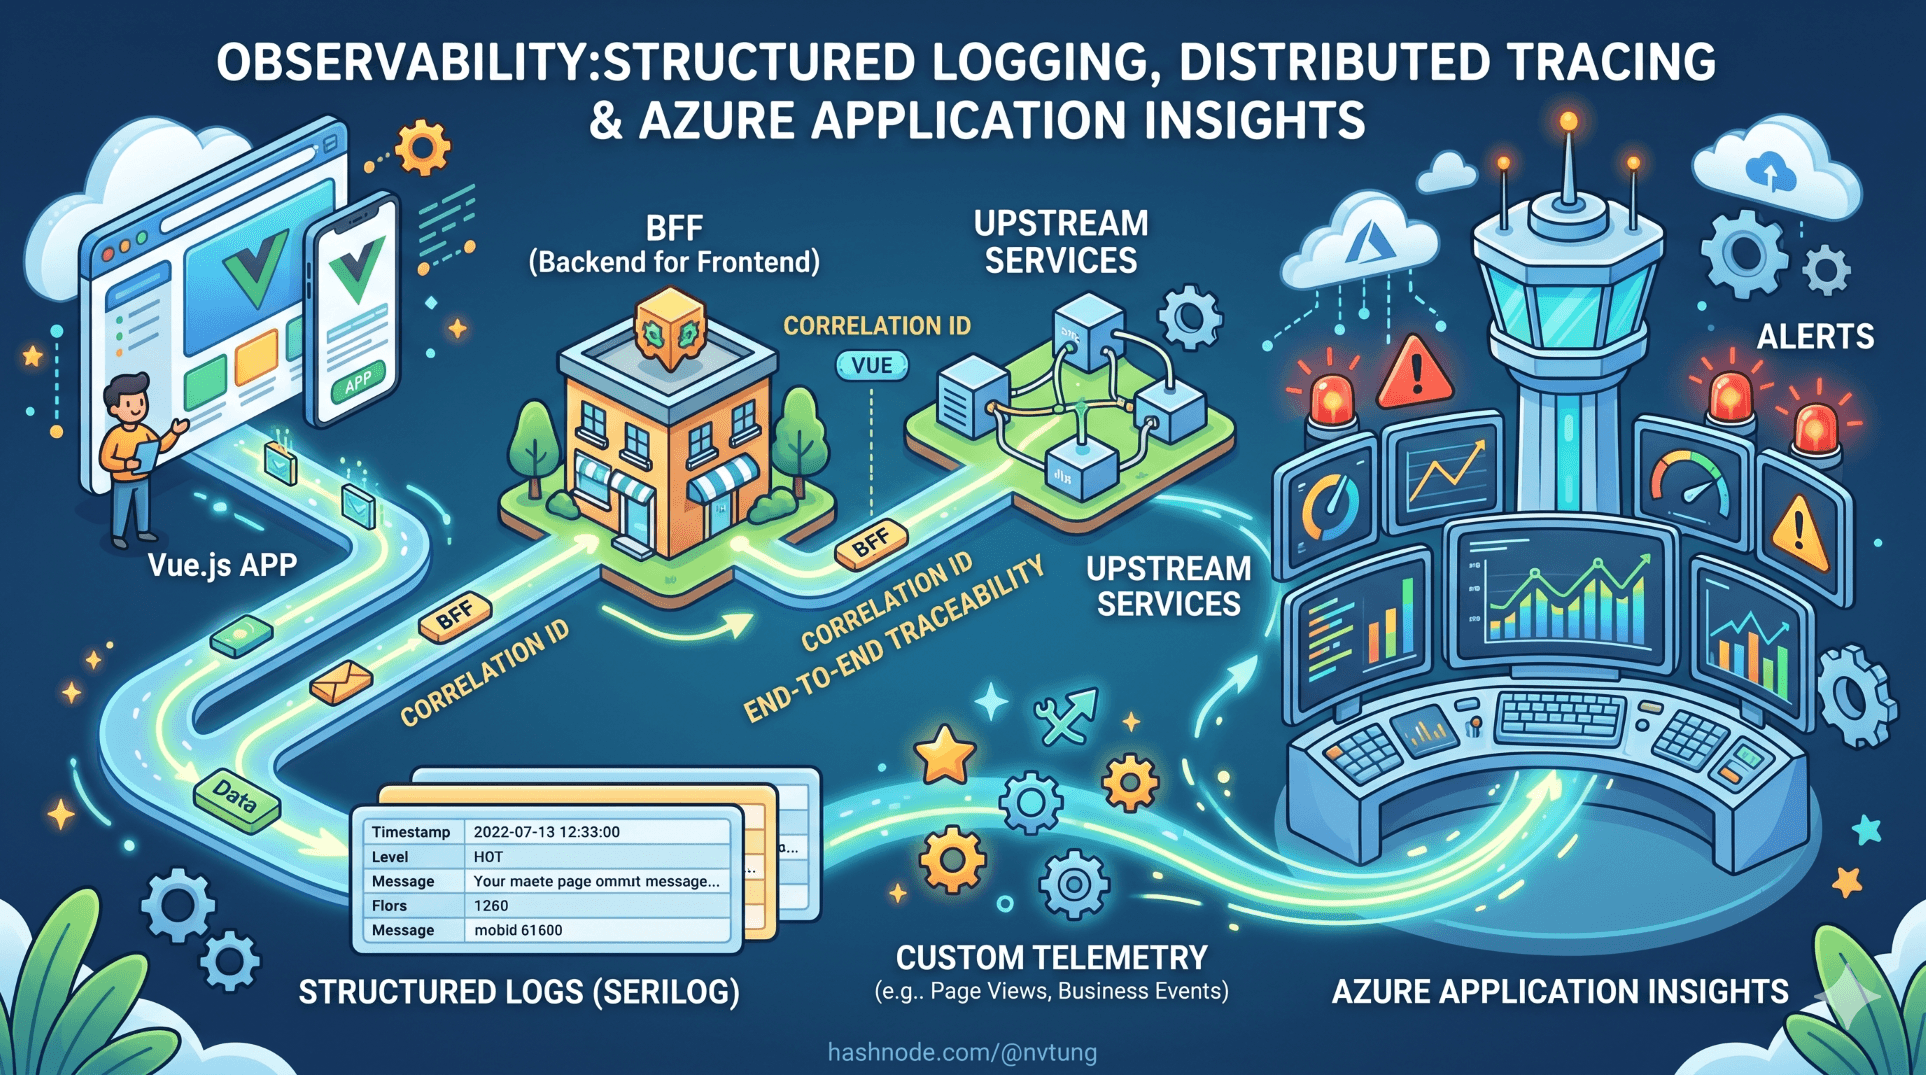
Start With the One Thing You Must Have: Correlation IDs
If you can’t answer:
“What happened to this event?”
You don’t have observability—you have noise.
Every event must carry a stable correlation ID from birth to death.
Event envelope example
{
  "event_id": "9b6c8c2a-7c9d-4b7f-9a1e-1e1f9a5b3f6a",
  "correlation_id": "req-81fa3",
  "event_type": "user.updated",
  "event_version": 1,
  "occurred_at": "2025-01-02T10:15:30Z",
  "data": { ... }
}
event_id→ idempotencycorrelation_id→ observability
They solve different problems. You need both.
Logging: Make Logs Event-Centric
PHP (producer)
$logger->info('Emitting event', [
    'event_type' => 'user.updated',
    'event_id' => $eventId,
    'correlation_id' => $correlationId,
    'user_id' => $userId
]);
.NET Processor
_logger.LogInformation(
    "Processing event {EventId} ({EventType}) Correlation {CorrelationId}",
    evt.EventId,
    evt.EventType,
    evt.CorrelationId
);
Node.js consumer
logger.info("Event received", {
  event_id: event.event_id,
  correlation_id: event.correlation_id,
  type: event.event_type
});
Logs without event IDs are anecdotes.
Logs with IDs become timelines.
Metrics That Actually Matter
1. Queue Depth (Pressure)
RabbitMQ
Messages ready
Messages unacked
Redis Streams
Stream length
Pending entries per consumer group
These tell you:
Is the system falling behind?
Where pressure is accumulating?
2. Lag (Time as a Signal)
Track:
now() - occurred_at
This single metric answers:
“How stale is my system?”
Example (Node.js)
const lagMs = Date.now() - Date.parse(event.occurred_at);
metrics.histogram("event.lag.ms", lagMs);
Lag matters more than throughput.
3. Retry & DLQ Rates
Retries and DLQs are not errors—they are signals.
Track:
Retry count per event type
DLQ volume over time
DLQ age (how long messages sit unhandled)
A growing DLQ is an organizational alert, not just a technical one.
Distributed Tracing (Without Synchronous Calls)
Tracing async systems is hard—but possible.
The trick
You don’t trace calls.
You trace causality.
Each step emits a span using the same correlation_id.
.NET example (pseudo OpenTelemetry)
using var span = tracer.StartActiveSpan(
    "process.user.updated",
    SpanKind.Consumer,
    new SpanContext(correlationId)
);
Node.js continuation
tracer.startSpan("notify.user", {
  links: [{ context: extractContext(event.correlation_id) }]
});
The trace becomes a timeline, not a stack.
Observing Redis Streams Specifically
Redis Streams give you observability hooks for free—if you look.
Pending messages
XPENDING events user-group
If this grows:
Consumers are slow
Consumers are dead
Messages are poison
Idle time
Idle time tells you how long messages have been stuck.
Stuck messages are more dangerous than missing ones.
Observing RabbitMQ Pipelines
RabbitMQ exposes exactly what event systems need:
Queue depth
Unacked messages
Consumer count
Publish rate vs ack rate
Alert when:
Queue grows steadily
Ack rate drops to zero
One consumer owns all unacked messages
Those are architectural smells, not just incidents.
Event Timeline Debugging (The Most Powerful Tool)
With proper logging and IDs, debugging becomes linear:
Find
event_idSearch logs across services
Reconstruct the journey
You can answer:
Was it emitted?
Was it buffered?
Was it processed?
Was it retried?
Was it dead-lettered?

Without this, debugging is guesswork.
The Anti-Patterns That Kill Observability
Avoid these at all costs:
Logging without event IDs
Metrics only at service level
No lag measurement
DLQs without alerts
“We’ll add observability later”

Later is always too late.
Observability Is a Design Feature
You cannot bolt observability onto an event-driven system after the fact. It must be designed in:
Event envelopes carry IDs
Consumers propagate context
Pipelines expose pressure
Failures surface visibly

This is architecture, not tooling.
A Simple Observability Checklist
If you can answer these in production, you’re doing well:
How many events are currently stuck?
Where are they stuck?
How old is the oldest event?
Which event types retry most?
Can I trace one event end-to-end?

If not, the system is operating on faith.
Closing Thought
Event-driven systems trade immediacy for resilience.
Observability is how you regain confidence.
When you can see:
Time
Flow
Pressure
Failure
Asynchrony stops being scary and starts being predictable.
Good observability doesn’t make systems faster.
It makes them trustworthy.
And trust is what lets distributed systems scale—technically and humanly.