
Datahub: Reliability, Failure, and Observability
Designing event-driven systems that fail visibly and recover safely
Series: Designing a Microservice-Friendly Datahub
PART II — DESIGN PRACTICES: THE “HOW”
Previous: Designing for Decoupling and Evolution
Next: Scaling Patterns and Anti-Patterns
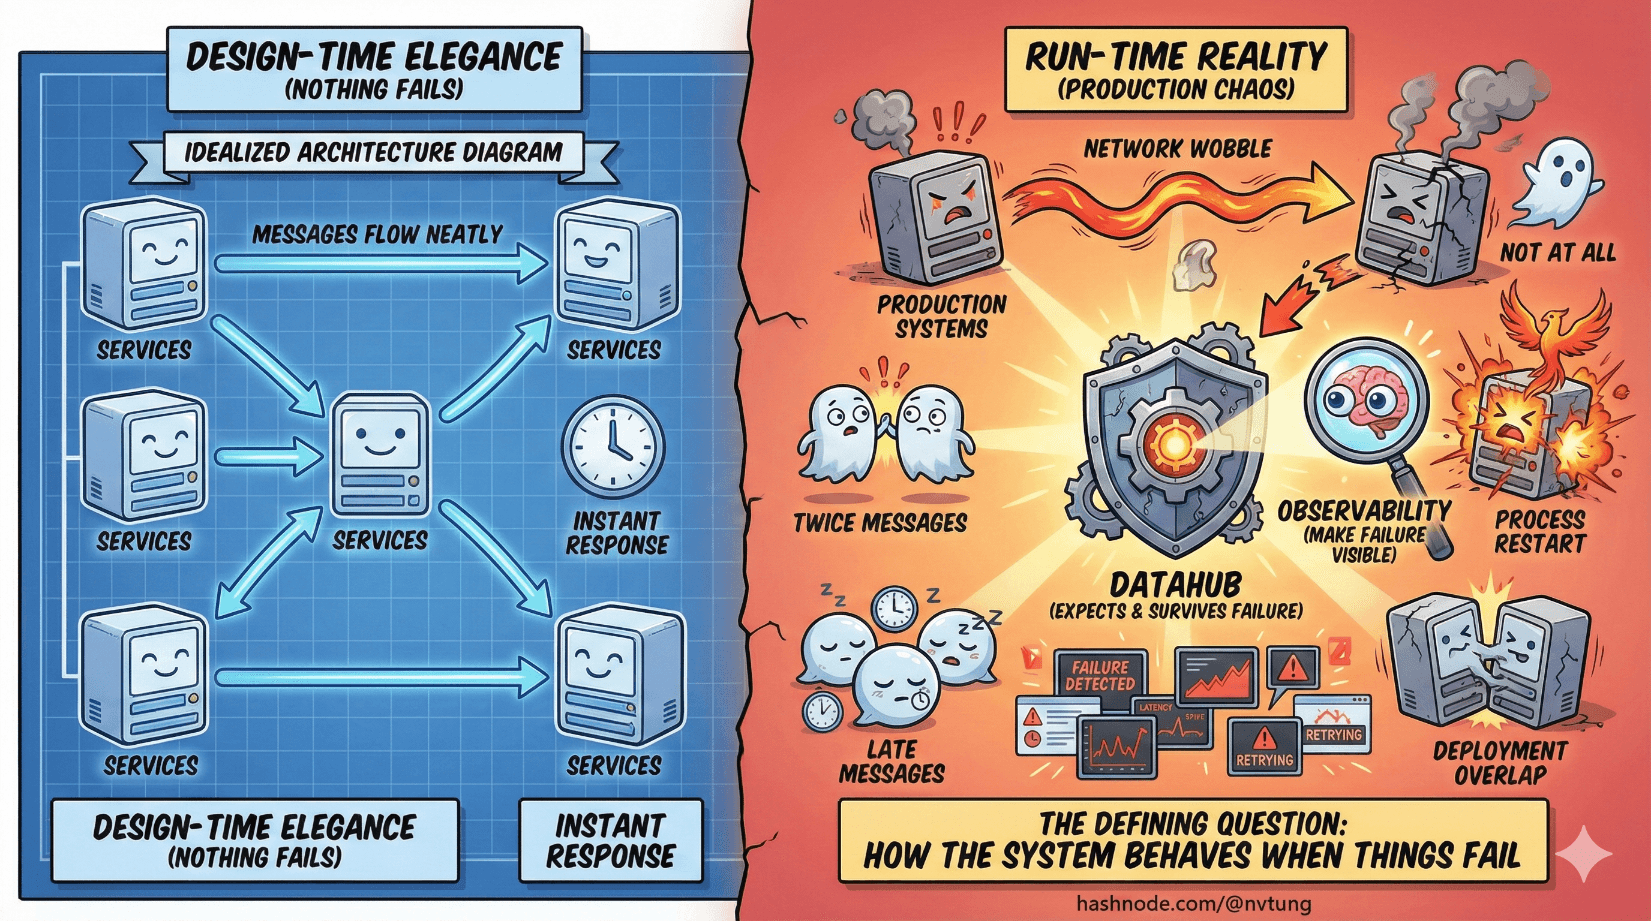
Most architecture diagrams are drawn in a world where nothing fails. Messages flow neatly, services respond instantly, and every arrow behaves itself. Production systems do not live in that world.
In production, networks wobble. Processes restart. Deployments overlap. Messages arrive late, twice, or not at all. The defining question of a Datahub architecture is not whether things fail—but how the system behaves when they do.
This article shifts the lens from design-time elegance to run-time reality. It’s about building systems that expect failure, survive it, and—most importantly—make it visible.
Failure Is Normal (Design Accordingly)
In distributed systems, failure is not an exception. It’s background radiation.
Hardware fails. Containers die. Networks partition. Consumers lag. If your system assumes reliability, it will behave unpredictably under stress. If it expects failure, it can respond deliberately.
The goal of a reliable Datahub is not to prevent failure. It is to:
Contain failure
Recover from failure
Make failure observable

Everything else—retries, DLQs, monitoring—exists in service of that goal.
Retries: Turning Temporary Failure Into Progress
Retries are the first and most misunderstood reliability mechanism.
A retry is an admission that:
The failure might be transient
Success is still possible
Time is a valid variable
In event-driven systems, retries are inevitable. Networks fail briefly. Services restart. Dependencies time out. Retrying turns these hiccups into non-events—if the system is designed for it.

Retry Discipline Matters
Poorly designed retries cause more damage than failure:
Retry storms amplify load
Immediate retries hammer sick services
Infinite retries hide broken logic
Good retry strategies:
Use exponential backoff
Cap retry attempts
Separate transient from permanent failures
Combine retries with visibility
Retries should be boring. If you notice them constantly, something else is wrong.
Dead-Letter Queues: The Safety Net
Eventually, some messages cannot be processed.
They might:
Violate a schema
Trigger an unhandled edge case
Depend on data that no longer exists
Reveal a genuine bug
This is where dead-letter queues (DLQs) come in.
A DLQ is not a trash bin. It’s a quarantine zone.

Messages end up in a DLQ when:
They exceed retry limits
They fail deterministically
They cannot be processed safely
The DLQ gives you:
A place to inspect failures
A way to prevent pipeline blockage
A mechanism for controlled reprocessing
Without DLQs, systems either block forever or silently discard data. Both are unacceptable.
Poison Messages: When One Event Breaks Everything
A poison message is an event that:
Always fails processing
Fails fast
Fails consistently
Left untreated, poison messages can:
Block consumer queues
Starve healthy messages
Create infinite retry loops
DLQs are the antidote.

When poison messages are isolated:
Healthy traffic continues
Failures become actionable
Engineers can debug without pressure
The presence of poison messages is not a sign of poor design. The absence of a strategy for handling them is.
Monitoring Pipelines: Seeing the Flow, Not Just the Nodes
Most teams monitor services. Far fewer monitor pipelines.
In Datahub architectures, the health of the system lives between components, not inside them. You need visibility into:
Queue depths
Consumer lag
Processing latency
Retry counts
DLQ volume

These signals tell you:
Where pressure is building
Which consumers are falling behind
Whether failures are transient or systemic
Monitoring the pipeline answers questions like:
“Is data flowing?”
“Where is it slowing down?”
“What is failing silently?”
If you only monitor CPU and memory, you’re flying blind.
Backpressure: Respecting System Limits
Backpressure is what happens when producers can outpace consumers.
In synchronous systems, backpressure shows up as timeouts. In asynchronous systems, it shows up as queues growing.
Backpressure is not a bug. It’s a signal.

Healthy systems:
Allow queues to absorb bursts
Slow producers when limits are reached
Protect downstream services from overload
Unhealthy systems:
Drop messages
Cascade failures upstream
Collapse under load spikes
Backpressure turns overload into latency instead of outage. That’s a trade worth making.
Visibility Is a Feature, Not an Afterthought
A system that fails loudly is better than one that fails quietly.
Silent failures are the most dangerous kind because:
They corrupt state slowly
They evade alerts
They erode trust
Good observability makes failure:
Measurable
Localized
Actionable

This means:
Metrics for message flow, not just service health
Logs tied to message IDs
Alerts on stagnation, not just crashes
Dashboards that show movement, not just uptime
If you can’t answer “where did this event go?” you don’t control your system—you’re guessing.
Thinking Operationally Changes Design Decisions
When you think operationally, architecture choices change.
You start asking:
Can this message be retried safely?
What happens if this consumer is down for an hour?
How will we detect stalled pipelines?
Where do broken events go?
These questions don’t complicate architecture—they clarify it.

Systems designed with operations in mind:
Fail smaller
Recover faster
Age more gracefully
Reliability Is Emergent, Not Configured
You don’t configure reliability into existence. You design it.
Retries without idempotency create bugs.
DLQs without monitoring create graveyards.
Backpressure without visibility creates slow disasters.
Reliability emerges when:
Failure is expected
Recovery is intentional
Visibility is built-in

This is where Datahub architectures earn their keep—not in diagrams, but at 3 a.m. when something breaks and the system keeps breathing anyway.
Where We Go Next
Reliability and observability keep systems alive when things go wrong—but scale introduces a different kind of pressure. As load, data volume, and team count grow, new failure modes emerge that no amount of monitoring alone can solve. In the next article, we’ll look at Scaling Patterns and Anti-Patterns, focusing on what breaks first as systems grow and how to recognize architectural smells before they turn into outages.